Autor: Carlos Contreras
The COVID-19 pandemic has proven to be a formidable challenge to public finances. Governments have responded to the shock of the pandemic with measures that boost public deficits, such as transfers to businesses and households, unemployment benefits, tax cuts and tax deferrals. In addition, tax revenues have declined due to the contraction of economic activity. In Spain, due to increased public spending, reduced revenue collection, and the contraction of GDP itself, the ratio of government debt to GDP exceeded 120% by the end of 2021, while at the end of 2019 this ratio stood at 95.5%.
Other measures have also been adopted during the pandemic. Governments have provided credit guarantees to ensure that companies with liquidity problems could find bank financing. Public guarantee schemes (PSGs) have been significant in countries such as Spain, Italy, and France. In the case of Spain, PGSs have been managed by the ICO. The amount of guarantees provided by the Spanish public agency are shown in Table 1.
Table 1. Amount of guarantees granted by the ICO al 30 September 2021 (in billions of euro)
Public guarantee schemes do not have an immediate impact on the government deficit, but they are contingent liabilities that can affect government accounts if (and when) the guarantees have to be called. Therefore, there could be a second-round effect on public debt.
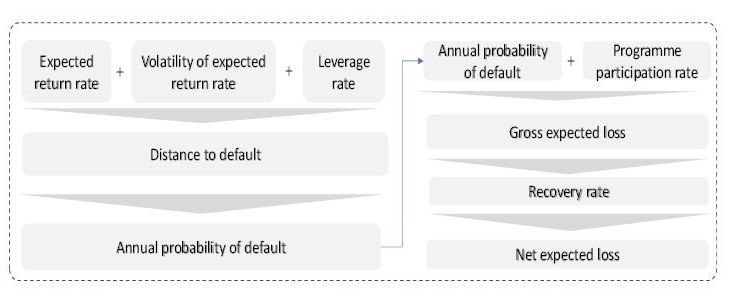
Our article illustrates the results obtained by Contreras and Angulo (2021). In that article, we consider that a public financial agency creates a portfolio of guarantees consisting of a number of sub-portfolios with a ranking criterion based on firm size. It is assumed that some of the companies that have been financed by banks (taking advantage of public guarantees) will go bankrupt. Therefore, the corresponding collaterals will be called, the public sector will incur losses, and the level of public debt will increase. Our paper estimates both the expected value of the increase in public debt resulting from these guarantee schemes and the risk of deviation from this amount in the event of unexpected adverse behaviour of solvency risk parameters of the financed companies. To this end, we estimate a probability of default for four types of firms according to their size. To do so, we first evaluate the distance to default by considering parameters such as the expected annual return, the volatility of this return and the level of leverage. Then, we calculate the expected gross loss amount based on the previously estimated bankruptcy probabilities. Assuming different recovery rates depending on the size of the firm, we calculate the corresponding expected net loss for each type. As a last step, we assess the total contribution by company type to the increase in public debt, so that we can estimate the aggregate impact of PGSs on public accounts. Since publicly available information does not fully meet our desired breakdown by type of firm, we make an additional assumption regarding the allocation of guarantees granted. Figure 1 provides a summary of the methodology used.
Figure 1: Summary of the methodology
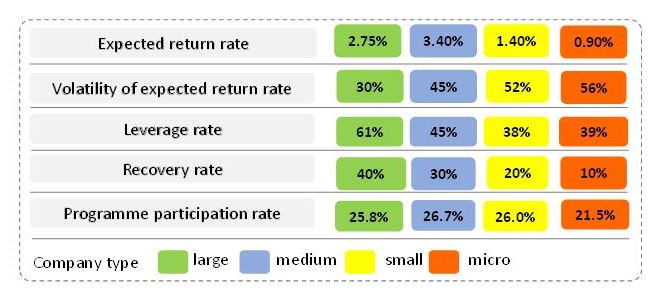
Figure 2 illustrates all the assumptions we have used in relation to the variables mentioned above
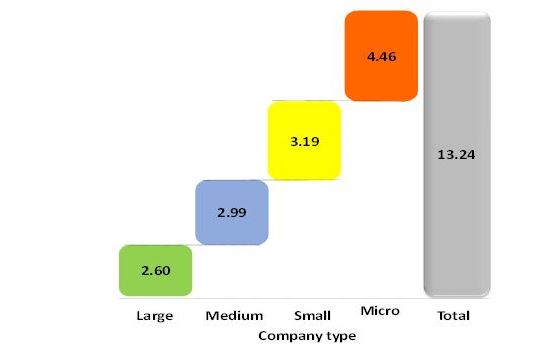
With the above assumptions, the aggregate results for a three-year period indicate a cumulative net loss of 13.24 billion euros. The breakdown of the contribution by type of company is as shown in Figure 3.
Figure 3. Breakdown of cumulative net losses over a three-year period (bn.€)
The increase in the level of debt is a random variable, and in order to determine the expected range of variation with respect to the central scenario, for a given confidence level, two additional variables need to be considered. In particular, we assume a recovery rate volatility of 30% for the four types of firms, and an average default correlation between each pair of guarantees of 5%. As a result, with a confidence level of 95%, we estimate that the increase in debt would range between EUR 12.85 and 13.61 billion euros.
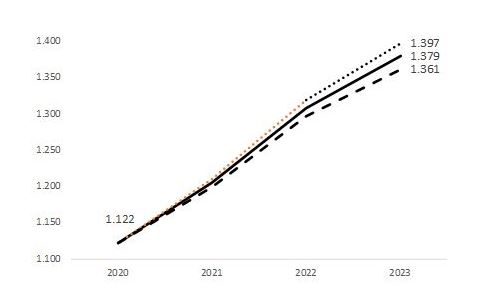
Finally, to express this result as the increase in the debt-to-GDP ratio, we have assumed three scenarios of GDP evolution between 2021 and 2023. These scenarios are, in turn, the combined result of various paths of real GDP growth rates and implicit GDP deflator rates. See Figure 4.
Figure 4. Scenarios of nominal GDP evolution (€ bn.)
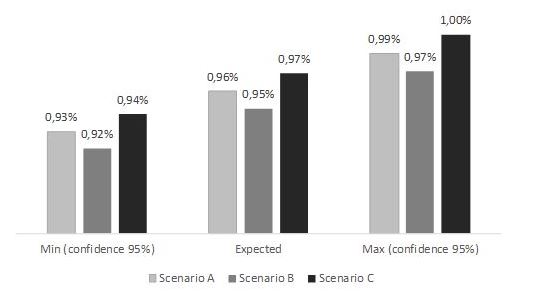
Under the above assumptions, we estimate that the Spanish public guarantee programme for corporate financing could result in an increase in the debt-to-GDP ratio of between 0.92 and 1.00 percentage points in 2023. See Figure 5.
Figure 5. Estimated increase in the debt-to-GDP ratio by 2023resulting from the public guarantee programme
References
Contingent Liabilities Arising from Public Guarantee Schemes to Mitigate COVID-19 Pandemic: The Case of Spain.
https://papers.ssrn.com/sol3/papers.cfm?abstract_id=3989608
Autores:
Carlos Contreras. MSc in Economics (University of York), PhD in Economics (UCM). Associate Professor of Applied Economics UCM (on leave). His research has been published in journals such as Review of Public Economics IEF, Revista de Economía Aplicada, Journal of Public Administration, Finance and Law, Applied Economic Analysis, Journal of Infrastructure Systems, Papeles de Economía Española, Información Comercial Española and others.
Julio Angulo. Licenciado y Doctor en Ciencias Matemáticas y Licenciado en Ciencias Físicas. Ha trabajado en finanzas, en el ámbito académico y en consultoría. Autor de varias monografías y artículos especializados sobre física, finanzas y gestión de riesgos en revistas como Physica A, Applied Economic Analysis, Journal of Infrastructure Systems e Instituto de Estudios Fiscales entre otras.


