
Autor: Carlos Contreras
Some policy makers have placed net wealth taxes (NWTs) at the top of their agenda as a chance to fight inequality. In principle, one would think that net wealth taxes reduce poverty where in force, albeit at the cost of negative effects on economic efficiency. However, the first statement may not necessarily be true in a context of taxpayer mobility and/or if this form of taxation produces economic inefficiencies that reduce the country’s tax bases. If some of the taxpayers with the highest income and wealth leave the tax jurisdiction, the loss of tax revenue (from income and consumption taxes) may result in a reduction in the level of public spending that individuals in the lower income brackets receive. A similar situation may arise if the negative impact on tax revenue caused by the inefficiency effects of NWT is strong enough. Experience suggests that a combination of both effects tend to occur. Using a highly stylized, yet nontrivial, model this paper provides a numerical simulation to show the arithmetic of the impact of the NWT on poverty in plausible scenarios. The paper concludes that this tax may increase poverty depending on the intensity of the tax expatriation and the magnitude of the negative economic effects.
Description of the economy
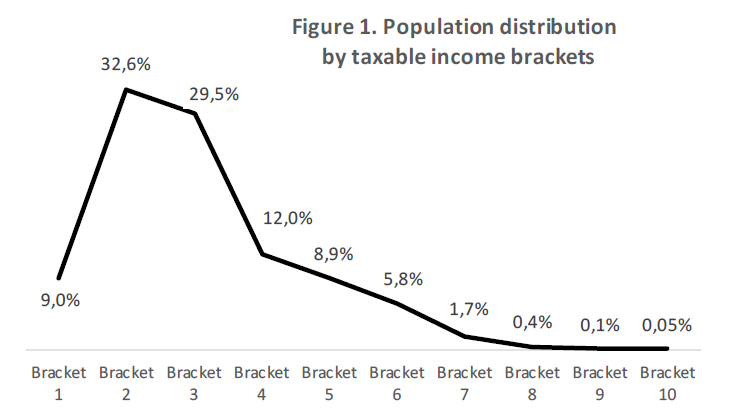
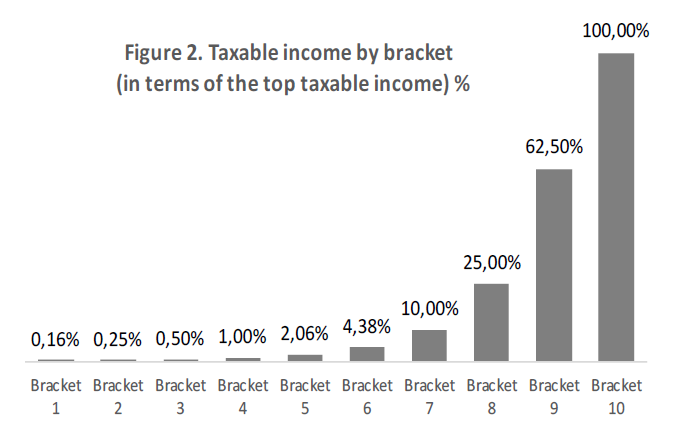
Consider a country whose population is stratified according to taxable income in ten brackets. See Figure 1. The taxable income that corresponds to each bracket, expressed as a percentage of the income at the top bracket, is shown in Figure 2. For example, each taxpayer in bracket 1 (together representing 9% of the total population) has a taxable income equivalent to 0.16% of the income in the top bracket. Similarly, individuals with the highest taxable income represents 0.05% of the population.
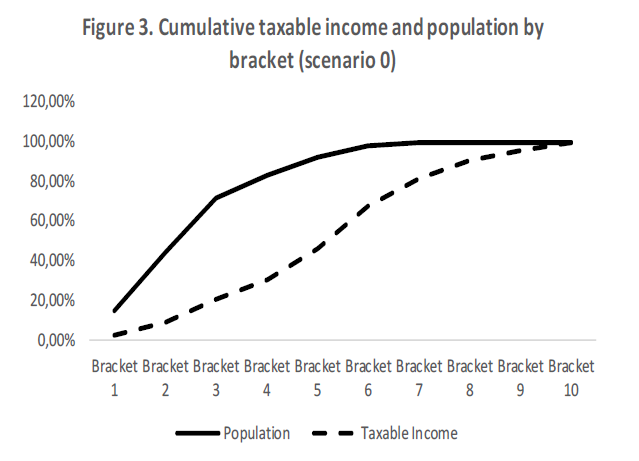
If there were no taxes or public spending (scenario 0), the gap between accumulated income and accumulated population by taxable income bracket, which offers a picture of social inequality, would be the one shown in Figure 3.
Consider now that the government collects through a progressive income tax and a proportional consumption tax (scenario I) such that effective tax rates are as exhibited in Table 1.

Other assumptions for this hypothetical economy are as follows: All tax revenue, and not more than this amount, is distributed to citizens in the form of public expenditure.1 No tax fraud occurs. The propensity to consume decreases with income according to the function given in Figure 4. Wealth is generated by the investment of savings according to a multiplier that grows with income, following the function given in Figure 5. It is assumed that returns on investment of higher-income individuals are higher because of better information and access. The government spends according to a multiplier that decreases with income, reflecting the redistributive profile of public expenditure policy. See Figure 6.

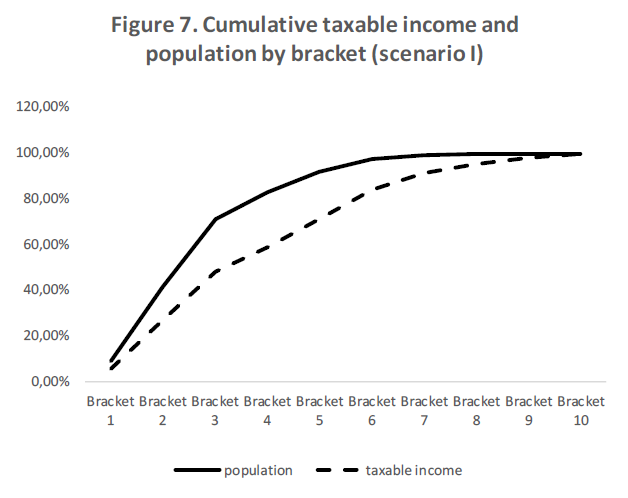
The key variable for the analysis is the adjusted disposable income (ADI), defined as income net of tax plus the value of public expenditure received by taxpayers. In scenario I, the picture of social inequality improves compared to Figure 3. See Figure 7.
Now imagine that the government establishes a net wealth tax with an exempt amount (equivalent to 12.5% of the taxable income of the upper bracket) and a ceiling that limits the joint taxation of income plus wealth in terms of total annual income (60%). Resulting effective tax rates of the NWT are shown in Table 1. In this economy, only taxpayers in income brackets 8 to 10 would be liable to pay this tax (0.55% of the population).
Model of analysis and results
Poverty refers to a situation involving a lack of disposable income and a consequent low level of consumption. The starting point for measuring poverty is to establish a socially agreed welfare threshold (SAWT), that we set at a level equivalent to 4 times the taxable income of the first bracket, (or 0.75% of the income of the top bracket). We calculated two measures of «poverty» in the five scenarios shown in Table 2.

The first measure is the so call the head-count ratio, which indicates the proportion of people whose adjusted disposable income is below the SAWT. If net wealth is not taxed (scenario I), 9% of the population or individuals in bracket 1 are in this status. See Figures 8 and 9.
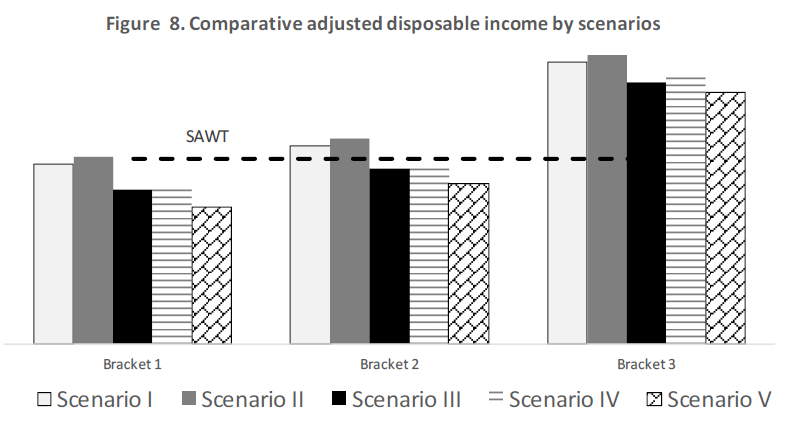
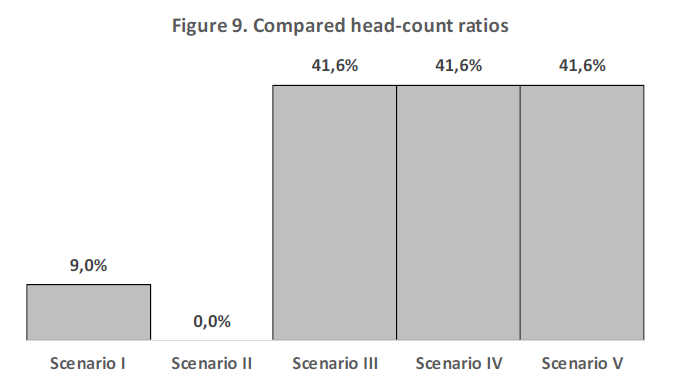
If there were no negative effects on economic efficiency and no taxpayers were to leave the tax jurisdiction, the introduction of the NWT would generate an increase in tax revenue (1.32%) to be distributed among low-income people -scenario II-. In this context, the head-count ratio would be reduced to 0%. See Figures 8 and 9.

In scenario III, some taxpayers among those liable to pay the NWT decide to leave the tax jurisdiction. For simplicity it is assumed that all taxpayers with the same income
behave identically. Let us set the proportion of leavers at 0.15% of the population (27% of those liable to pay the NWT). This tax expatriation implies a 4.25% net reduction in available public expenditure. The increase in NTW collections paid by taxpayers who remain (0.65%) is insufficient to compensate for the loss of income tax revenue (4.57%) and excise tax revenue (0.33%). See Table 3. Now, not only individuals in bracket 1 but also those in bracket 2 are below the SAWT. See Figure 8. This implies that the head- count ratio would go from 9.0% to 41.6%. See Figure 9.
In Scenario IV, it is assumed that there is no tax migration but the introduction of the NWT contracts tax bases of the country by 5%. Now, the reduction in public spending represents 4.51%. The increase in tax collection due to the NWT (1.13%) does not offset the loss of income tax revenue (4.72%) and excise tax revenue (0.92%). See Table 3. Again, the disposable income of individuals in brackets 1 and 2 falls below the “poverty” line and the head-count ratio also rises to 41.6% of the population. See Figures 8 and 9.
In Scenario V, it is assumed that only 0.05% of the population leaves the jurisdiction because of the NWT (9% of those liable to pay the NWT) and there is a contraction in the country’s tax base of just 2.5%. The net reduction in public spending reaches 7.41%, because of the increase in NTW collections of those who remain (0.52%) and the combined loss of income and excise tax revenue due to tax flight and the shrinkage of tax bases (7.93%). See Table 3. Again, disposable income of individual in brackets 1 and 2 fall below the SAWT, with the head-count ratio standing at 41.6%, as in scenarios III and IV. See Figures 8 and 9. In addition, individuals in income bracket 3 (representing 29.5% of the population) are now closer to the SAWT, with this distance narrowing by 4.4 percentage points to 9.6%. See Table 4.

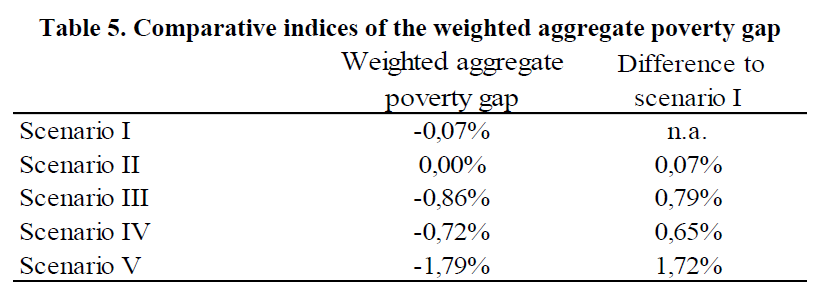
The second measure of poverty is the weighted aggregate poverty gap, an index that weights the proportional distance to the SAWT of the ADIs of those whose income is below this threshold. The NWT implies an increase of 0.79 and 0.65 percentage points in scenarios III and IV respectively, while this increase reaches 1.72 percentage points in the case of scenario V. See Table 5.
Conclusions
Considering a hypothetical economy with plausible characteristics in terms of income distribution, tax rates, propensity to consume rates and the redistributive profile of public spending, it is shown that the introduction of a net wealth tax can easily lead to an increase in poverty rates. All that is needed for this to occur is the existence of low-intensity tax expatriation combined with a slight contraction of the country’s tax bases.
1 It implies that: i) the government’s debt is zero or that its funding cost is zero so that it does not have to pay interest, ii) costs of administration and compliance of taxes and expenditures are null and iii) the government does not run deficits or surpluses, which is a long-term equilibrium condition.
Carlos Contreras: Licenciado y Doctor en Economía (UCM) y M.Sc. in Economics (University of York). Profesor Titular de Economía Aplicada (en excedencia). Ha publicado en Review of Public Economics IEF, Revista de Economía Aplicada, Journal of Public Administration, Finance and Law, Applied Economic Analysis, Journal of Infrastructure Systems, Papeles de Economía Española, Información Comercial Española, Journal of Insurance and Financial Management etc. Autor entre otros libros de “El papel del gobierno en la era digital” o “DeFi: ilusiones, realidades y desafíos”.


